Volume of imports
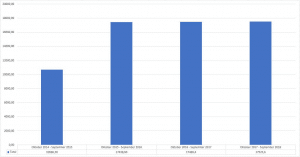
Imports of chia seeds into the European Union (EU) increased only 0.2% by volume in the period October 2017– September 2018 (Figure 1).
Figure 1: Chia imports in tons per year, 2014/15 – 2017/18, year ending September
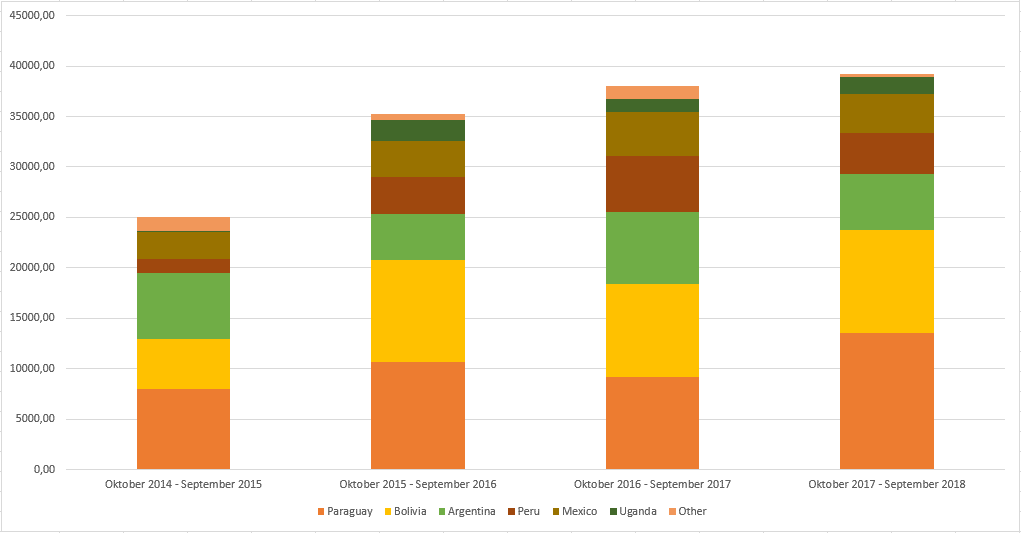
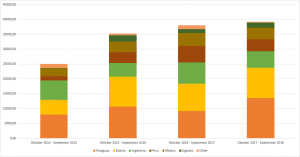
Paraguay remains the biggest exporter to the European Union with 5417 tons, followed by Bolivia with 4456 tons and Argentina and Peru, each at 2.6 thousand tons (Figure 2). Since 2016, Uganda has become a substantial exporter to Europe with currently 617 tons. Mexico is stable at 1500 tons. Other producing countries export very small quantities to Europe. Together, Nicaragua, Ecuador, Australia, Kenya, Zimbabwe, Zambia, and Tanzania exported 111 tons in the year ending September 2018.
Figure 2: Chia exports to EU countries in tons per year, October 2014 – September 2018
Import value grows
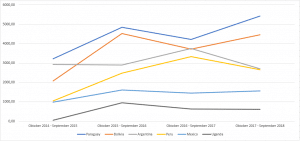
Import value did show some growth, of 3.1% in the year ending September 2018 (Figure 3). Since import volume remained stable, this growth is due to a rise in the average price. In the previous year, ending September 2017, growth was 8.0%. This means that growth is slowing down in value as well as volume. In the year ending September 2016 the market grew by 40.8%. Based on these statistics it is likely that European demand for chia has reached a phase of stability.
Figure 3: Value of imports per country in €1000, 2014/15 – 2017/18, year ending September
Price trend
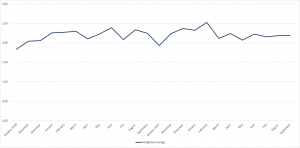
Over the last two years, the chia import price has known some fluctuations, with a peak of €2.53 per kg in May 2018 and a low of €1.84 per kg in October 2016 (Figure 4). Overall the price remained relatively stable, with a small tendency to increase. From March till September 2018, the average price fluctuated slightly around €2.15 per kg. Year on year (from October to September) the average chia import price increased with 3,1%, as mentioned previously. These prices cover all kinds of chia (black, white, organic, conventional).
Figure 4: Average chia price per month in euros, October 2016 – September 2018
Main origins
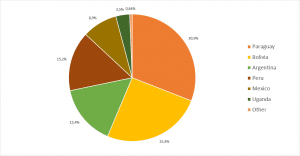
Paraguay remains the biggest exporter to the EU, with a share of almost 31% of the total exports of chia seeds (Figure 5). Bolivia comes in second, but the difference between these countries is growing. In the year ending September 2018, Paraguayan exports increased by 28%, Bolivian exports by 20%, and Mexican exports by 8%. Two other main players saw their exports to the EU decreasing: Peru by 20% and Argentina by 28%.
Figure 5: Share of main origins in European imports by volume, October 2017 – September 2018
Destination of imports
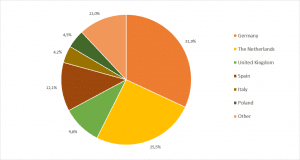
Germany and the Netherlands are the biggest importers of chia within the European Union. Together they account for 57% of European imports (Figure 6). The difference between Germany and the Netherlands got smaller, as German imports fell 12.4% and Dutch imports grew 38%. Consequently, the Dutch import share went from 18.5% to 25.5%. Last year, only six countries of 28 in the European Union had not imported chia. This shows that popularity of chia seed has spread beyond the early adopters in western Europe, although the imports of eastern Europe are still relatively small. France, a big importer of other superfoods like quinoa, has a very small share in chia imports: only 2.2%.
Figure 6: Share of the total EU import per import country by volume, October 2017 – September 2018
Source: Eurostat

